Quantum finance math,
explained without the hype.
What do probability amplitudes, phase-space embedding, Shannon entropy, Hawkes processes, Ising models and Markov regimes actually do in a market-analysis terminal? This page explains the mathematics Tidava uses, what it does not claim, and how to read the output.
Short answer: “Quantum finance” can mean quantum computing for finance, or it can mean quantum-inspired mathematics running on classical computers. Tidava uses the second approach. We borrow probability amplitudes, interference, state spaces, entropy and lattice models; we do not use a quantum computer, claim quantum advantage, or promise predictive certainty.
Start 7-day free trial →Open glossaryRead methodology
Who this is for
This is written for traders, quantitative researchers, finance students and technically curious analysts searching for quantum finance math, quantum-inspired trading, phase-space market analysis or market regime mathematics. It is not a textbook and it is not investment advice. The purpose is to make the terminal’s model families legible, so you can judge whether the approach fits your research process.
1. Probability amplitudes and interference
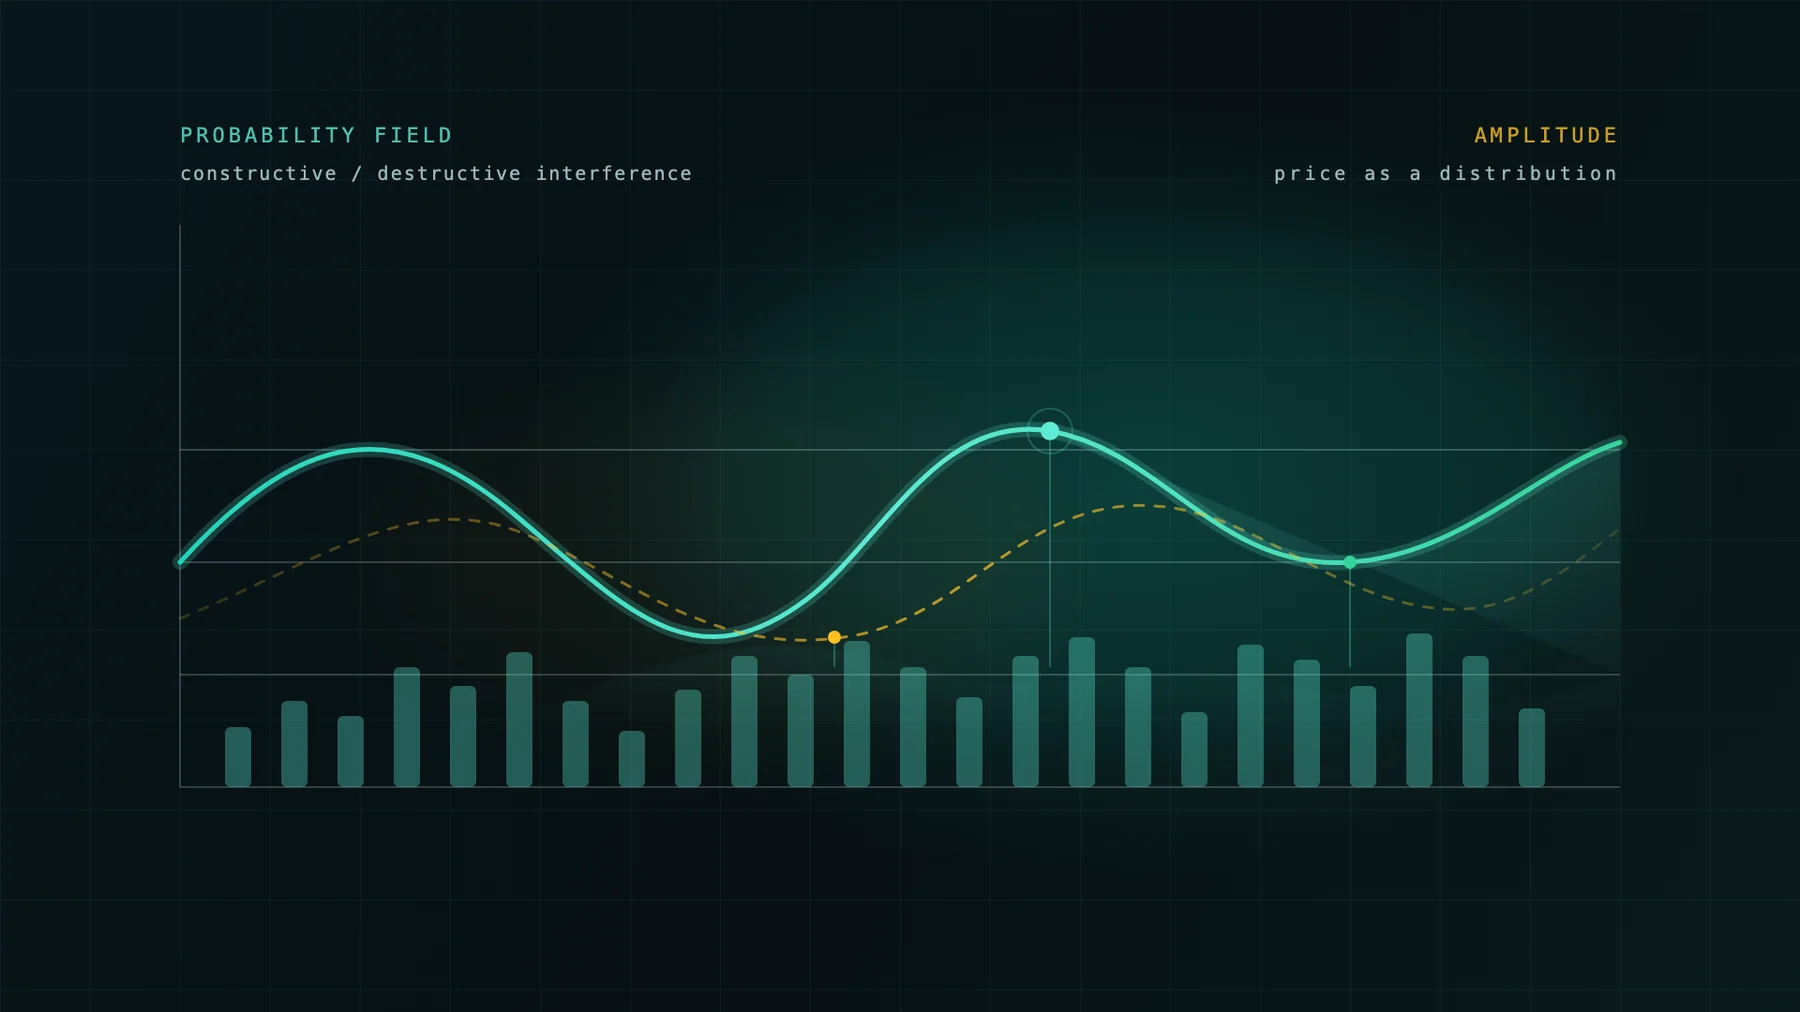
A classical probability model assigns a non-negative probability to each outcome. A quantum-inspired model starts with a complex-valued amplitude for each market state and combines amplitudes before converting to probabilities.
Born-style probability: P(si) = |αi|²
Interference: |α1 + α2|² = |α1|² + |α2|² + 2 Re(α1 α2*)
In Tidava, the probability-wave field visualises this idea over price levels and time. Constructive interference marks states that reinforce each other; destructive interference marks states that cancel. The terminal presents a probability field, not a single prophecy.
This is an analogy and a modelling choice. It is not a quantum-physical claim about markets.
2. Phase-space embedding and Takens’ theorem
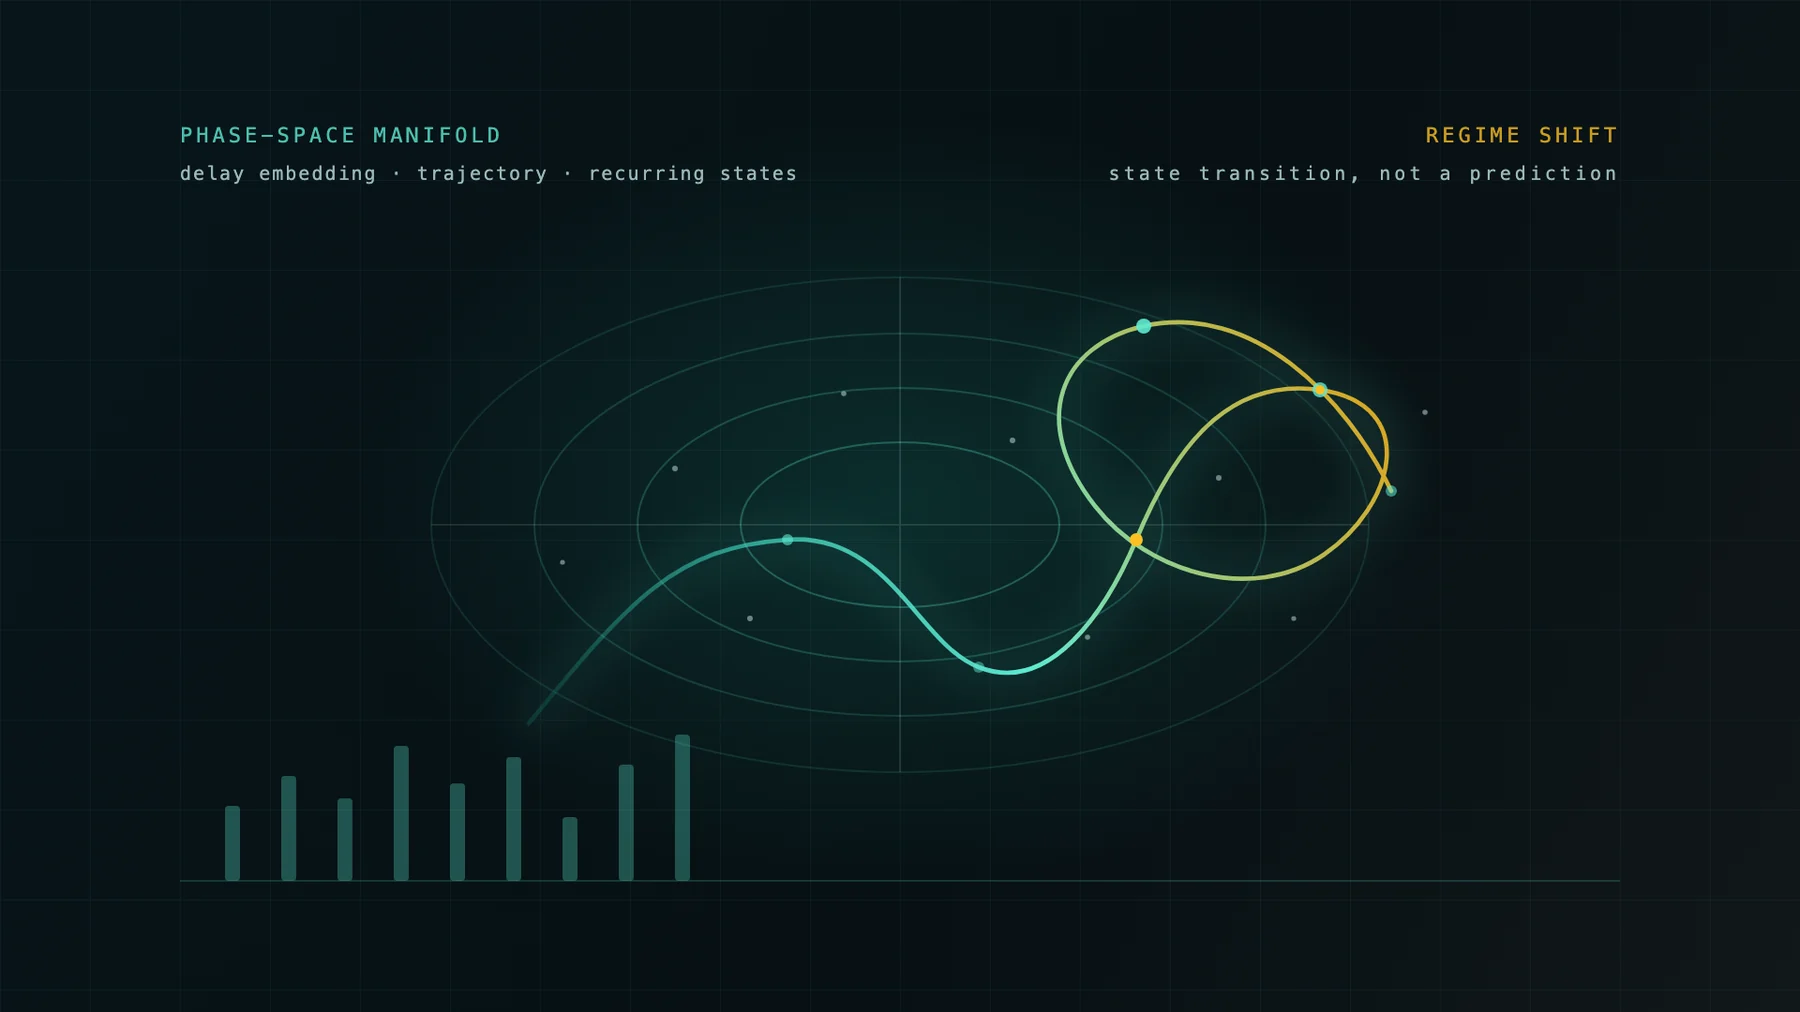
Price is a one-dimensional projection of a higher-dimensional dynamical system. Delay embedding reconstructs a state-space trajectory from a single time series.
Takens: for a generic smooth system, a sufficiently large m and suitable τ preserve the topology of the underlying attractor.
In practice, Tidava’s phase-space panel lets you see recurring trajectories, state transitions and whether the current path resembles a structured orbit or noise. The displayed geometry is a diagnostic lens, not a deterministic forecast.
3. Shannon entropy
Entropy measures how spread out a probability distribution is. A market with one dominant state has low entropy; a market spread across many equally likely states has high entropy.
In the terminal, the entropy field helps separate coherent structure from noise and regime ambiguity. Low entropy does not mean “safe”; it means the model sees a more concentrated state distribution.
4. Hawkes self-exciting processes
Market activity clusters: a trade can raise the probability of more trades. A Hawkes process models that self-excitation with an intensity that jumps at events and decays over time.
Tidava uses microstructure-style intensity and flow context to describe crowding and event clustering. It is a statistical description of activity, not a guarantee that a move will continue.
5. Ising sentiment and crowd alignment
The Ising model was built for interacting spins. In a market-sentiment analogy, each agent or signal is a spin and neighbouring spins influence each other.
The useful output is alignment: is sentiment coherent, fragmented, or near a phase transition? Tidava presents that as context, not as a buy/sell instruction.
6. Markov regimes
A Markov regime model treats the market as switching between hidden states with different return and volatility behaviour.
Expected next-state distribution: πt+1 = πt P
Regime labels — trend, range, volatile, thin liquidity — are model estimates. They can be wrong, especially around structural breaks. The terminal shows the current state and context so you can decide whether to trust it.
7. Wavelets and multi-scale structure
Wavelets decompose a signal into time-localised frequency components, which is useful when market behaviour changes across horizons.
Tidava uses multi-scale context to compare short-term noise with longer-horizon structure. Wavelet output is descriptive, not a prediction engine.
8. Transformer attention
The transformer block uses scaled dot-product attention to weight different parts of a sequence.
Tidava’s forecast panel is a research component, not a claim that a neural network knows the future. It is evaluated as a model, with limitations stated on the methodology page.
What the real terminal shows
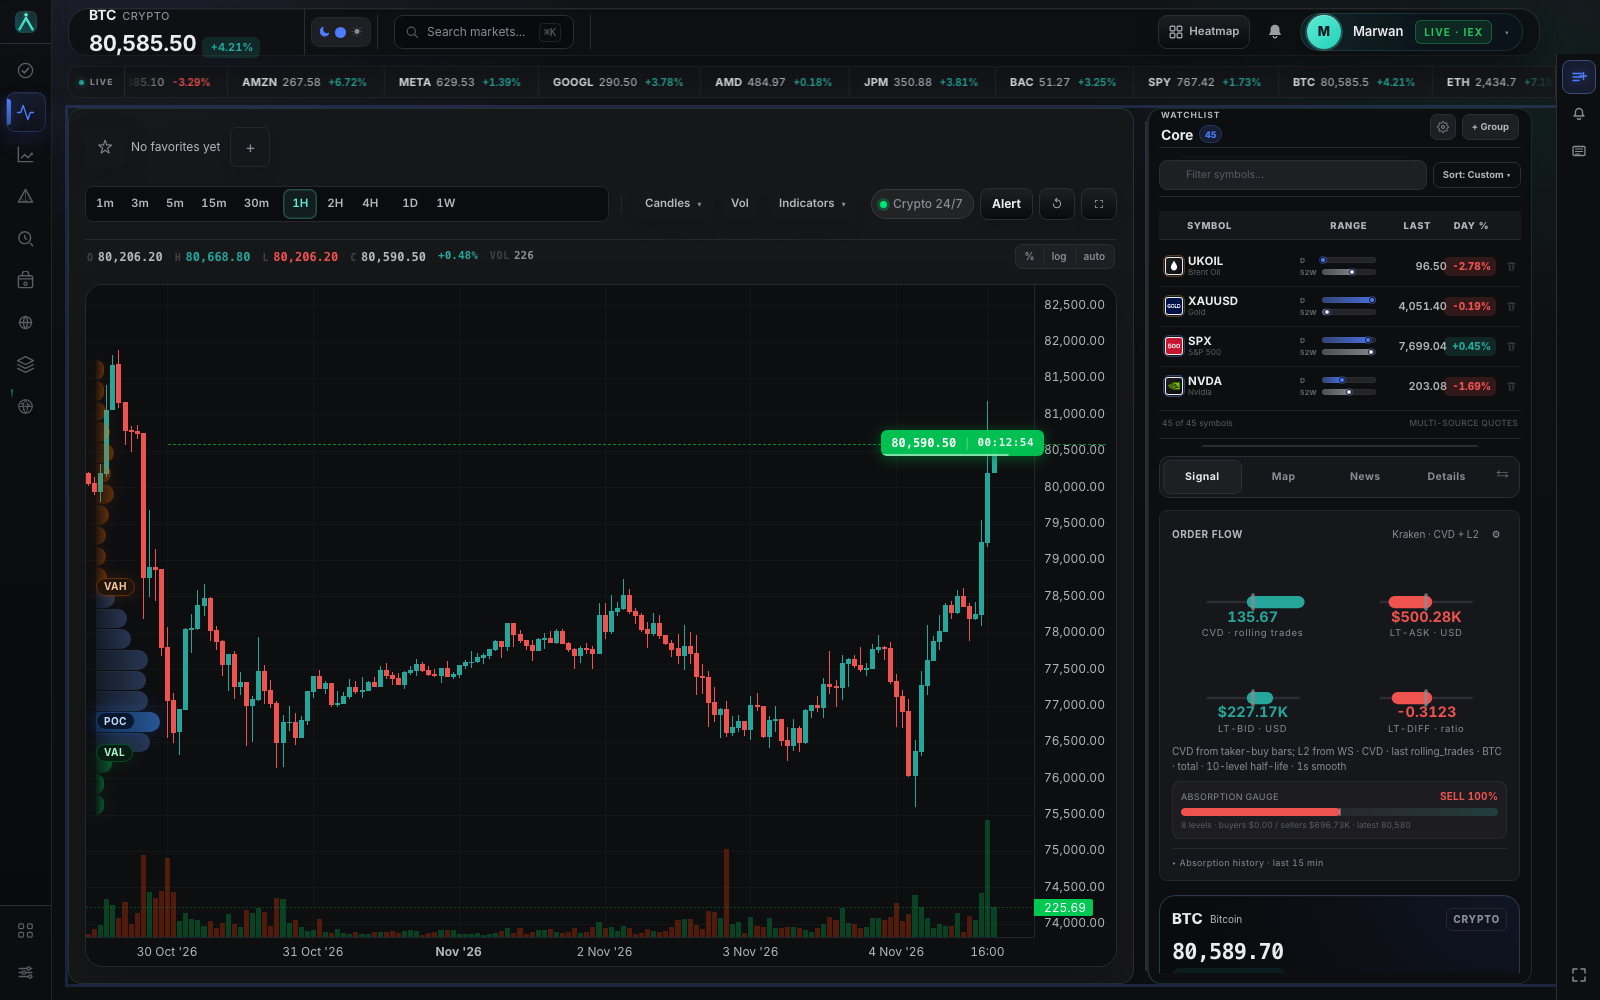
The screenshot below is the actual Tidava terminal, not a conceptual mockup. It shows the chart, watchlist, order-flow panel, signal/map/news/details tabs and the multi-source quote context. The model panels are illustrative of the analysis layer; they are not a promise of returns.

Concept diagrams
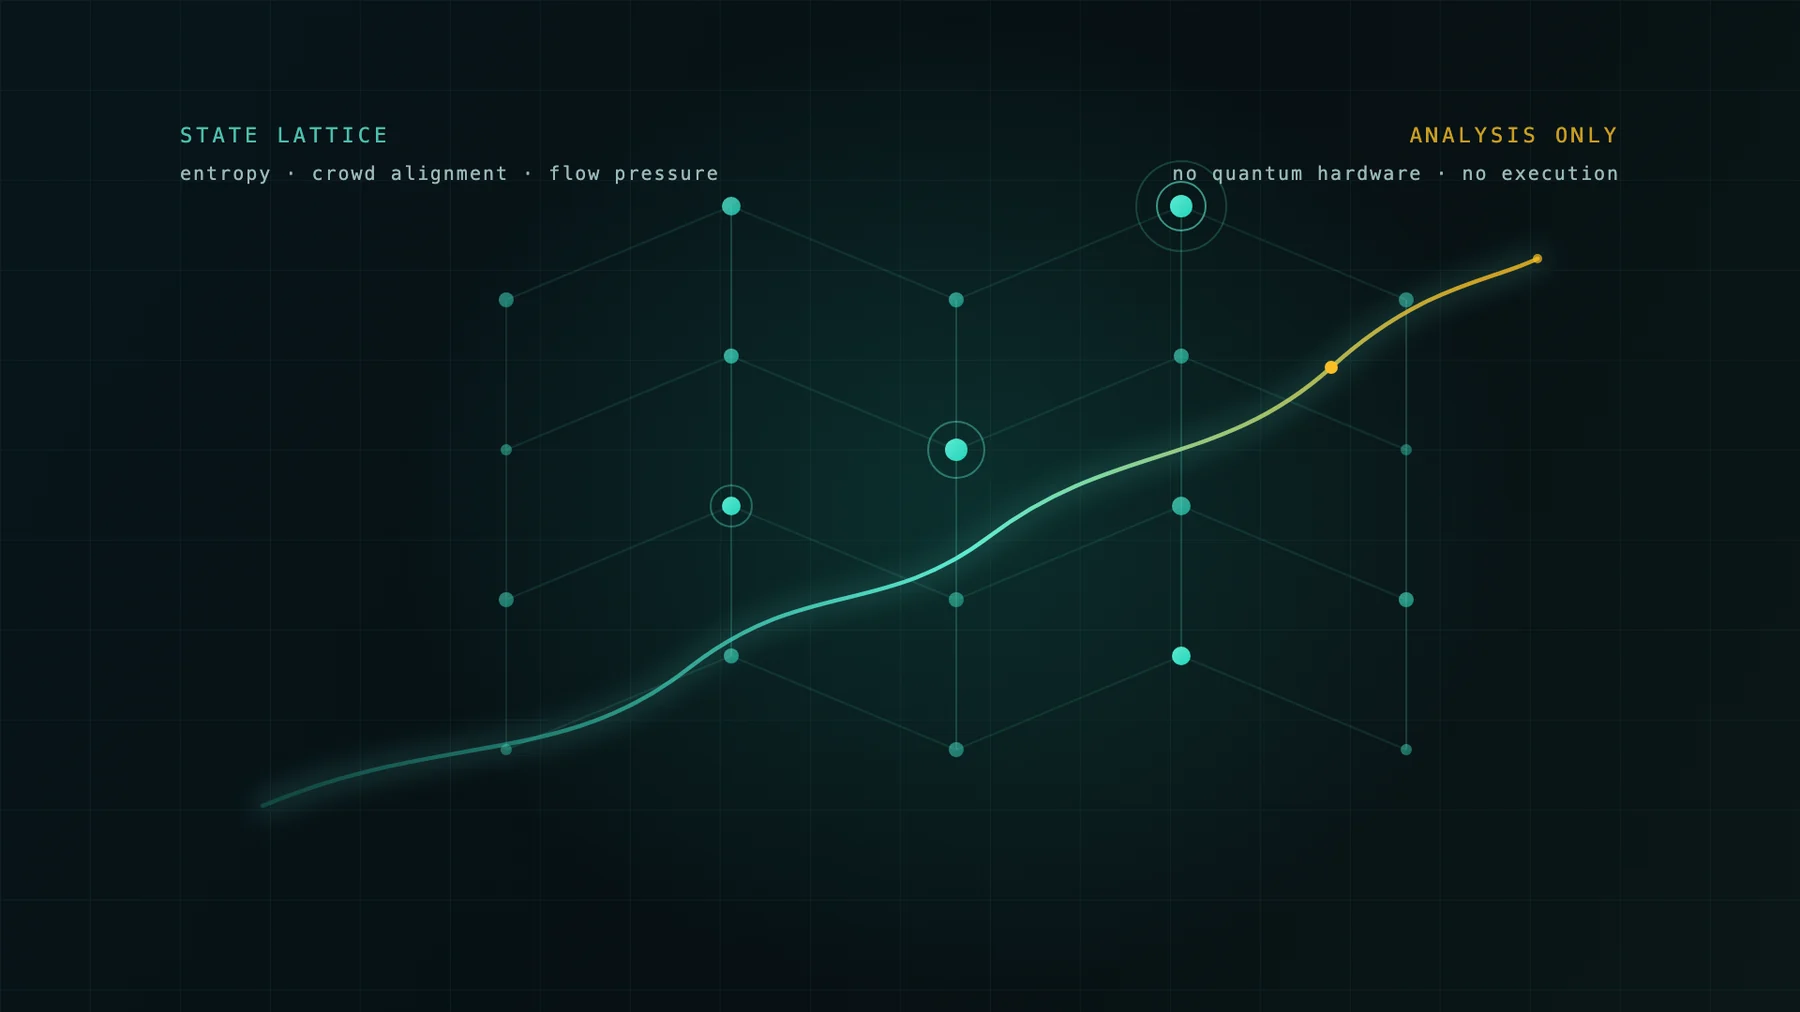
How to read the terminal without overclaiming
- Probability is not certainty. A high-probability state can fail; a low-probability state can happen.
- Regime labels are estimates. Structural breaks can invalidate a regime mid-trade.
- Microstructure data is venue-specific. Tidava’s equity live feed is IEX, not the consolidated tape.
- Models are research tools. No model removes risk, and nothing on this page is financial advice.
Market need: why this page exists
Most “quantum trading” searches return either quantum-hardware hype or opaque signal sellers. The market need is different: technically literate traders want to know what the math is, how it is implemented, what data it uses and what its limits are. Tidava addresses that need with a transparent analysis terminal and explicit methodology. The goal is not to sound more quantum than competitors; it is to make the model families understandable and testable.
References and further reading
Takens, F. (1981), “Detecting strange attractors in turbulence.” · Shannon, C. E. (1948), “A Mathematical Theory of Communication.” · Hawkes, A. G. (1971), “Spectra of some self-exciting and mutually exciting point processes.” · Ising, E. (1925), contribution to the theory of ferromagnetism. · Hamilton, J. D. (1989), “A New Approach to the Economic Analysis of Nonstationary Time Series and the Business Cycle.” · Vaswani, A. et al. (2017), “Attention Is All You Need.” · Tidava methodology: /methodology
Frequently asked questions
Does Tidava use a quantum computer?
No. The models are quantum-inspired and run on classical CPUs/GPUs. Tidava does not claim quantum hardware or quantum advantage.
Is quantum finance the same as quantum computing for finance?
No. Quantum computing for finance uses quantum hardware or simulators. Quantum-inspired finance borrows mathematical structures — amplitudes, interference, state spaces — and runs them on classical hardware.
Can this math predict markets?
No model can guarantee market outcomes. The math provides probability, structure and context; it does not remove risk or produce certain predictions.
What data does Tidava use?
Tidava combines market prices, OHLCV history, microstructure/flow where available, and multi-timeframe context. Equity live data is IEX via Alpaca; crypto uses Kraken; FX/metals fall back to Yahoo and can be delayed.
Where can I see the models in the product?
The terminal shows probability, phase-space, entropy, flow, volatility and forecast panels alongside conventional charts and watchlists. See the product overview and the methodology page.
Explore the terminal →PricingFree tools
Last updated November 2026 · Educational and product documentation, not financial advice. Tidava is analysis-only and does not execute orders.